
URICA: A Uniformity Region Affine Identifier Capture Algorithm for Arbitrary Region Retrieval in Pathology Images
Abstract
Whole slide image (WSI) region retrieval remains an open challenge in computational pathology, as existing methods struggle to represent and preserve information of all possible regions. Current approaches that rely on fixed-size patches or slide-level retrieval are misaligned with real clinical workflows, where pathologists often examine WSI regions of arbitrary orientations and sizes rather than predefined patches or slides. In this work, we redefine WSI retrieval as a semantically optimal matching problem between arbitrary regions under spatial transformations, which necessitates a region-level representation that maintains semantic consistency. To fulfill this requirement, we introduce semantic tessellation, which organizes patch units into flexible, geometry-aware region descriptors. Building on this representation, we develop the affine identifier, a semantic signature that enables rotation- and scale-consistent region matching. We further derive theoretical bounds between the tessellation-derived descriptors and the ideal pixel-level semantic mask objective, showing that they reliably approximate mask-based region similarity. Together, these components form URICA, a theoretically grounded algorithm for robust WSI region retrieval. Experiments on large public datasets demonstrate that URICA achieves strong and consistent performance across diverse WSI retrieval tasks.
1. Motivation & Key Insight
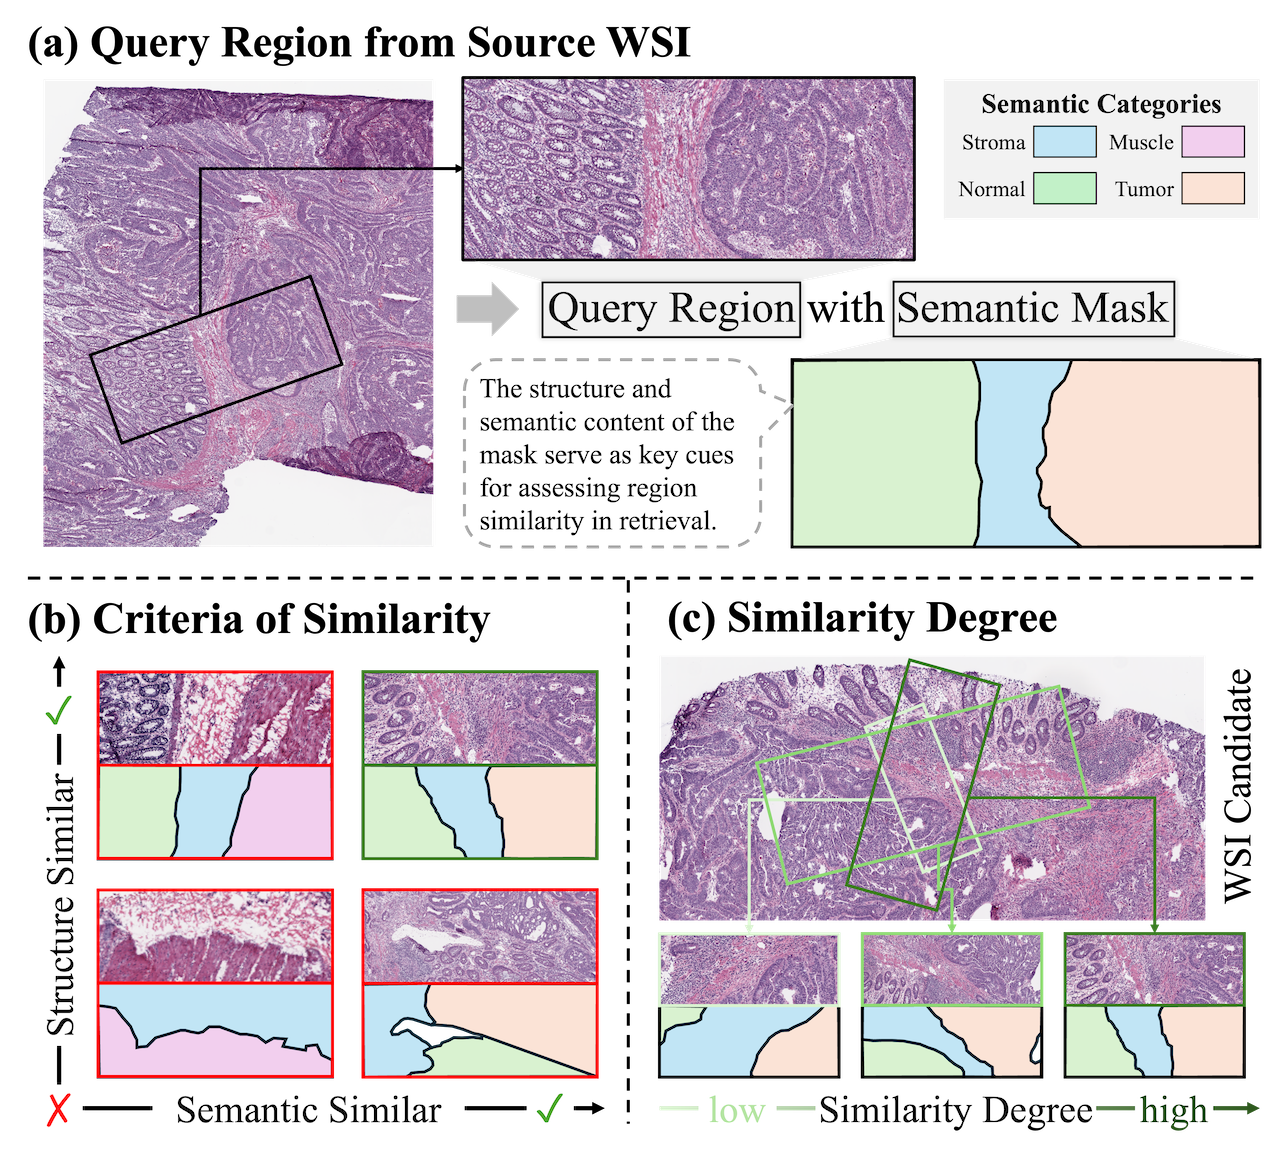
Whole-slide image (WSI) analysis often reduces pathology to either patch classification or slide-level retrieval. However, real clinical reasoning happens at the region level: a pathologist searches for tissue areas that share both semantic meaning (e.g., tumor vs. normal) and structural context (e.g., boundary patterns, gland architecture), under arbitrary rotations and scales.
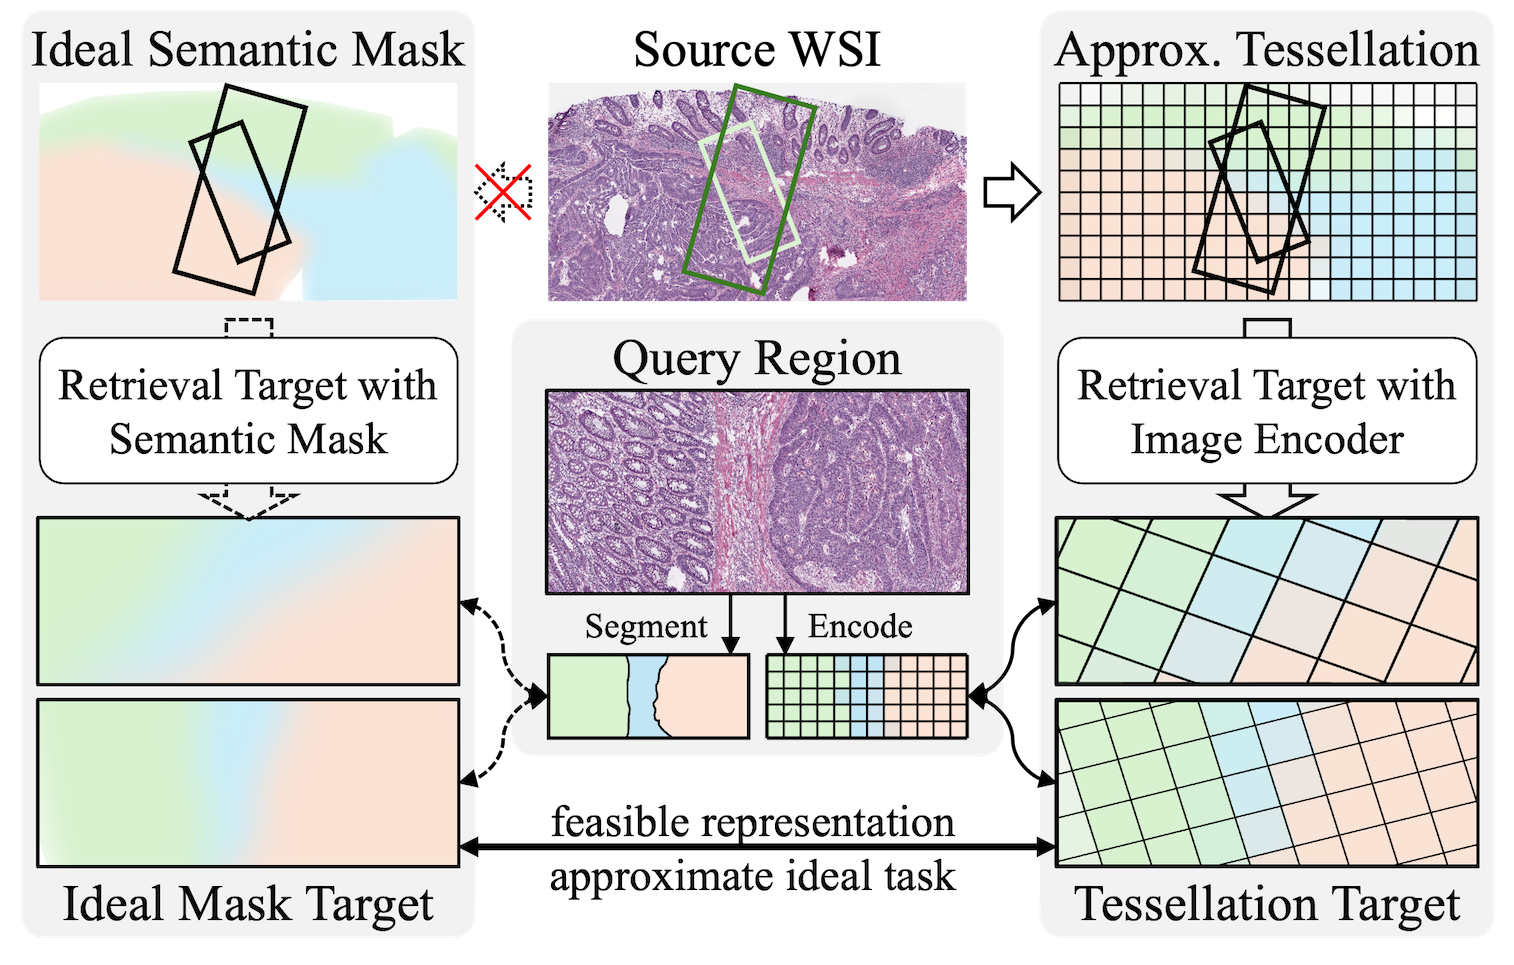
This makes WSI region retrieval fundamentally challenging. The “ideal” formulation would compare oracle semantic masks between regions, but such masks are rarely available and hard to generalize across cohorts. In practice, we only have encoder-derived patch embeddings, which are local, discrete, and lack an explicit notion of a region’s global geometry.
URICA is designed to bridge this gap: it reformulates arbitrary region retrieval as matching a set of region primitives that jointly preserve semantics and spatial structure, while remaining feasible with standard patch encoders.
The key insight is that a region can be represented not as a single vector, but as a structured set of anchors sampled from the region. If we can assign these anchors transformation-consistent identifiers, then region retrieval becomes the problem of finding a candidate region whose anchors admit the most uniform affine alignment (rotation + scale), instead of relying on fragile global pooling.
This perspective leads to a retrieval pipeline that is both faithful to the mask-based ideal and compatible with embedding-based indexing.
2. Method Overview
URICA builds a region retrieval system in three stages: indexing, query decomposition, and affine-consistent matching.
First, source WSIs are processed into a foreground patch database with embeddings produced by a foundation encoder, enabling efficient nearest-neighbor access. Then, a query region is decomposed into tessellated anchors that cover the region at a chosen step size. Finally, URICA searches for candidate regions by matching anchor sets and selecting the subset that exhibits the most consistent rotation/scale agreement, which is then used to reconstruct the retrieved region representation.
This pipeline turns arbitrary region retrieval into a principled “set alignment” problem, making retrieval robust to rotation and scale variations while preserving structural cues.

At the core of the matching step is the affine identifier: for each pair of anchors, URICA computes the angular difference and distance ratio between their query-side and retrieval-side embedding vectors. These pairwise signatures are invariant to rotation and scale, enabling the algorithm to identify the largest subset of anchors that share a consistent geometric transformation — effectively recovering the affine mapping between query and candidate regions.

As shown in Figure 3, with the target point as the shared starting point, each query affine (blue and purple solid arrows) yields several retrieved affine identifiers (dashed arrows). URICA validates uniformity in $\Delta\theta$ and $\Delta d$ across these pairs: for each tessellation vertex pair it computes angle and scale variation sets, then selects the consistent subsets $\{\theta\}^*$ and $\{d\}^*$ with minimal variance. When such a subset exists — i.e., the angle and scale shifts are uniform (arrows in the green box) — the average rotation $\theta^*$ and scale ratio $d^*$ over the consistent subset are used to relocate the retrieved region candidate. Specifically, the retrieved descriptor $\phi_{res}$ is computed as $w_{res} = w \cdot d^*$, $h_{res} = h \cdot d^*$, $\theta_{res} = \theta^*$, with its center obtained by rotating $(x^* - x_c,\, y^* - y_c)$ by $\theta^*$ and translating to the corresponding retrieved patch position $(x^*_{res}, y^*_{res})$. For a tessellation with $n$ anchors and patch queue length $k$, URICA generates $n \times k$ candidate regions, ranks them by similarity to the query embedding, and returns the top-$k$ most similar ones. Despite operating on sets, URICA remains practical at WSI scale by restricting computation to a compact anchor subset and aggregating alignment evidence efficiently.
3. Theoretical Foundation
A natural question arises: how faithfully does tessellation-based retrieval approximate the ideal pixel-level semantic mask comparison? URICA provides a theoretical answer.
Key Result: We derive tight upper and lower bounds relating the tessellation-based similarity to the ideal mask-based similarity. This guarantees that the tessellation approximation error is bounded and controllable.
Specifically, given an encoder with receptive field size $s^*$ and a measured semantic correlation decay rate $\alpha$, the optimal tessellation step size $t$ can be directly computed. The relationship between tessellation similarity and ideal mask similarity is governed by:
$$\frac{(2s)^{4\alpha}}{(2s-t)^{4\alpha}} - \frac{(2s-t)^{2\alpha}}{(2s)^{2\alpha}} = \frac{\psi^*(1+\xi)}{2(1-\psi^*)^4}$$
where $\psi^*$ is the ideal similarity threshold and $\xi$ captures boundary effects. This equation yields a closed-form solution for the optimal step $t$, balancing retrieval accuracy against computational cost.
Practical takeaway: With the empirically estimated $\alpha = 3$ and standard encoder size $s^* = 224$, the optimal step is $t \approx 60$ (coverage ratio $\eta = 0.7$). Compared to brute-force dense tessellation ($t = 50$), this reduces latency by 31.6% and storage by 30% with negligible accuracy loss.
This theory–practice alignment distinguishes URICA from purely empirical retrieval methods: the tessellation resolution is not an arbitrary hyperparameter but a principled design choice backed by formal analysis.
4. Experiment Results & Visualization
To evaluate WSI region retrieval, we measure whether the retrieved regions are consistent with the query in both semantic content (e.g., tissue type or lesion pattern) and spatial structure (e.g., boundaries and morphological arrangement), rather than matching only local textures. The tables below present URICA's quantitative results on TCGA region retrieval across all 10 anatomical sites and 29 cancer subtypes at top-1, top-3, and top-5 settings. Notably, URICA achieves the best mIoU on all 29 subtypes, demonstrating that it consistently recovers structurally faithful regions.
Inter-region retrieval experiment results of different methods on different subtypes of TCGA data with top-1 Results.
| WSI Site |
Query Num. |
Slide Method | Sample Method | Adjacent Method | URICA (ours) | ||||
|---|---|---|---|---|---|---|---|---|---|
| mSim@1 | mIoU@1 | mSim@1 | mIoU@1 | mSim@1 | mIoU@1 | mSim@1 | mIoU@1 | ||
| Pul. | 2763 | 0.7330 | 0.1981 | 0.8964 | 0.4760 | 0.6502 | 0.1258 | 0.9615 | 0.7108 |
| LUAD | 1320 | 0.7382 | 0.2002 | 0.8996 | 0.4738 | 0.6700 | 0.1365 | 0.9489 | 0.6302 |
| LUSC | 1335 | 0.7316 | 0.1975 | 0.8937 | 0.4823 | 0.6455 | 0.1217 | 0.9615 | 0.7272 |
| MESO | 108 | 0.7047 | 0.1885 | 0.8894 | 0.4259 | 0.5371 | 0.0840 | 0.8907 | 0.5422 |
| Liv./PB. | 886 | 0.7142 | 0.1893 | 0.8953 | 0.4458 | 0.5529 | 0.0915 | 0.8656 | 0.6179 |
| CHOL | 55 | 0.6786 | 0.1532 | 0.8914 | 0.4439 | 0.4646 | 0.0742 | 0.9479 | 0.6977 |
| LIHC | 520 | 0.7244 | 0.1858 | 0.9025 | 0.4403 | 0.5422 | 0.0856 | 0.8081 | 0.5514 |
| PAAD | 311 | 0.7035 | 0.2015 | 0.8840 | 0.4554 | 0.5865 | 0.1044 | 0.8819 | 0.6446 |
| Uri. | 3209 | 0.7337 | 0.1962 | 0.8979 | 0.4733 | 0.6189 | 0.1154 | 0.9409 | 0.7261 |
| BLCA | 588 | 0.6944 | 0.1791 | 0.8839 | 0.4303 | 0.5358 | 0.0815 | 0.8476 | 0.6482 |
| KIRC | 1805 | 0.7418 | 0.2008 | 0.9003 | 0.4879 | 0.6352 | 0.1221 | 0.9666 | 0.7461 |
| KICH | 265 | 0.7542 | 0.2019 | 0.9020 | 0.4780 | 0.6630 | 0.1385 | 0.9715 | 0.6551 |
| KIRP | 551 | 0.7396 | 0.1964 | 0.9029 | 0.4689 | 0.6329 | 0.1182 | 0.9712 | 0.7768 |
| Gyn. | 2562 | 0.7324 | 0.1935 | 0.8969 | 0.4615 | 0.5926 | 0.1025 | 0.8318 | 0.6489 |
| UCEC | 811 | 0.7223 | 0.1803 | 0.8939 | 0.4335 | 0.5324 | 0.0767 | 0.8032 | 0.6444 |
| CESC | 358 | 0.6827 | 0.1796 | 0.8854 | 0.4365 | 0.4941 | 0.0743 | 0.6563 | 0.5111 |
| UCS | 95 | 0.7343 | 0.1806 | 0.8911 | 0.4302 | 0.5555 | 0.0653 | 0.9645 | 0.7104 |
| OV | 1298 | 0.7522 | 0.2065 | 0.9025 | 0.4881 | 0.6601 | 0.1292 | 0.9652 | 0.7363 |
| Mel. | 645 | 0.6848 | 0.1807 | 0.8839 | 0.4276 | 0.5333 | 0.0806 | 0.7414 | 0.5543 |
| UVM | 97 | 0.6857 | 0.1833 | 0.8878 | 0.3889 | 0.5056 | 0.0603 | 0.9648 | 0.7394 |
| SKCM | 548 | 0.6829 | 0.1803 | 0.8832 | 0.4345 | 0.5382 | 0.0842 | 0.7134 | 0.5312 |
| Pro./Tes. | 1126 | 0.6866 | 0.1932 | 0.8830 | 0.4562 | 0.5726 | 0.1067 | 0.8701 | 0.6573 |
| TGCT | 292 | 0.6972 | 0.1966 | 0.8836 | 0.4516 | 0.5614 | 0.1049 | 0.7359 | 0.5424 |
| PRAD | 834 | 0.6829 | 0.1920 | 0.8828 | 0.4578 | 0.5765 | 0.1074 | 0.9184 | 0.6986 |
| Bra. | 2939 | 0.7418 | 0.1918 | 0.9055 | 0.4606 | 0.6177 | 0.1072 | 0.9473 | 0.7232 |
| GBM | 1739 | 0.7297 | 0.1916 | 0.8995 | 0.4611 | 0.6101 | 0.1081 | 0.9243 | 0.6997 |
| LGG | 1200 | 0.7594 | 0.1920 | 0.9142 | 0.4599 | 0.6288 | 0.1058 | 0.9763 | 0.7528 |
| Hem. | 286 | 0.7265 | 0.1907 | 0.8957 | 0.4544 | 0.5547 | 0.0927 | 0.8994 | 0.6948 |
| DLBC | 77 | 0.7133 | 0.1810 | 0.8998 | 0.4644 | 0.5923 | 0.0986 | 0.9634 | 0.7117 |
| THYM | 209 | 0.7314 | 0.1943 | 0.8941 | 0.4507 | 0.5408 | 0.0905 | 0.8807 | 0.6899 |
| Gl. | 2690 | 0.7056 | 0.1979 | 0.8880 | 0.4724 | 0.5968 | 0.1185 | 0.8901 | 0.6657 |
| COAD | 1140 | 0.7162 | 0.2033 | 0.8895 | 0.4775 | 0.5973 | 0.1199 | 0.8953 | 0.6655 |
| ESCA | 215 | 0.6805 | 0.1848 | 0.8808 | 0.4369 | 0.4849 | 0.0813 | 0.6362 | 0.5595 |
| READ | 389 | 0.7052 | 0.1947 | 0.8880 | 0.4693 | 0.5926 | 0.1171 | 0.9702 | 0.6922 |
| STAD | 946 | 0.6987 | 0.1958 | 0.8877 | 0.4757 | 0.6233 | 0.1259 | 0.8740 | 0.6659 |
| End. | 1163 | 0.7151 | 0.1806 | 0.8941 | 0.4435 | 0.5689 | 0.0918 | 0.8931 | 0.6396 |
| ACC | 229 | 0.7495 | 0.1879 | 0.8969 | 0.4744 | 0.6330 | 0.0948 | 0.9637 | 0.7611 |
| PCPG | 242 | 0.7203 | 0.1732 | 0.8998 | 0.4202 | 0.5780 | 0.0907 | 0.9597 | 0.7134 |
| THCA | 692 | 0.7019 | 0.1807 | 0.8912 | 0.4414 | 0.5445 | 0.0911 | 0.9056 | 0.7029 |
| WSI Site |
Query Num. |
Slide Method | Sample Method | Adjacent Method | URICA (ours) | ||||
|---|---|---|---|---|---|---|---|---|---|
| mSim@3 | mIoU@3 | mSim@3 | mIoU@3 | mSim@3 | mIoU@3 | mSim@3 | mIoU@3 | ||
| Pul. | 2763 | 0.7253 | 0.1909 | 0.8744 | 0.3867 | 0.2774 | 0.0436 | 0.9549 | 0.6819 |
| LUAD | 1320 | 0.7307 | 0.1933 | 0.8789 | 0.3881 | 0.2861 | 0.0478 | 0.9559 | 0.6698 |
| LUSC | 1335 | 0.7244 | 0.1904 | 0.8705 | 0.3890 | 0.2736 | 0.0419 | 0.9569 | 0.6991 |
| MESO | 108 | 0.6900 | 0.1758 | 0.8672 | 0.3412 | 0.2487 | 0.0294 | 0.9005 | 0.5756 |
| Liv./PB. | 886 | 0.7007 | 0.1751 | 0.8720 | 0.3457 | 0.2328 | 0.0315 | 0.8582 | 0.5868 |
| CHOL | 55 | 0.6593 | 0.1374 | 0.8670 | 0.3377 | 0.1801 | 0.0253 | 0.9420 | 0.6609 |
| LIHC | 520 | 0.7095 | 0.1708 | 0.8803 | 0.3361 | 0.2306 | 0.0296 | 0.8047 | 0.5201 |
| PAAD | 311 | 0.6935 | 0.1891 | 0.8590 | 0.3631 | 0.2458 | 0.0359 | 0.8697 | 0.6166 |
| Uri. | 3209 | 0.7273 | 0.1962 | 0.8758 | 0.3791 | 0.2597 | 0.0399 | 0.9344 | 0.6856 |
| BLCA | 588 | 0.6799 | 0.1693 | 0.8587 | 0.3262 | 0.2210 | 0.0280 | 0.8429 | 0.6195 |
| KIRC | 1805 | 0.7384 | 0.1969 | 0.8786 | 0.3951 | 0.2668 | 0.0423 | 0.9599 | 0.7073 |
| KICH | 265 | 0.7518 | 0.1994 | 0.8803 | 0.3865 | 0.2818 | 0.0477 | 0.9522 | 0.6049 |
| KIRP | 551 | 0.7295 | 0.1875 | 0.8828 | 0.3796 | 0.2672 | 0.0409 | 0.9654 | 0.7118 |
| Gyn. | 2562 | 0.7216 | 0.1824 | 0.8753 | 0.3656 | 0.2468 | 0.0353 | 0.8079 | 0.6029 |
| UCEC | 811 | 0.7093 | 0.1674 | 0.8717 | 0.3277 | 0.2136 | 0.0262 | 0.7520 | 0.5825 |
| CESC | 358 | 0.6600 | 0.1570 | 0.8604 | 0.3299 | 0.2142 | 0.0257 | 0.6514 | 0.4689 |
| UCS | 95 | 0.7225 | 0.1686 | 0.8678 | 0.3439 | 0.2364 | 0.0224 | 0.9634 | 0.6548 |
| OV | 1298 | 0.7461 | 0.1998 | 0.8821 | 0.4007 | 0.2772 | 0.0446 | 0.9595 | 0.7075 |
| Mel. | 645 | 0.6752 | 0.1691 | 0.8590 | 0.3245 | 0.2313 | 0.0281 | 0.7346 | 0.5190 |
| UVM | 97 | 0.6840 | 0.1718 | 0.8622 | 0.2907 | 0.2179 | 0.0211 | 0.9626 | 0.7291 |
| SKCM | 548 | 0.6736 | 0.1686 | 0.8584 | 0.3304 | 0.2337 | 0.0293 | 0.7061 | 0.4927 |
| Pro./Tes. | 1126 | 0.6800 | 0.1857 | 0.8584 | 0.3663 | 0.2326 | 0.0368 | 0.8654 | 0.6212 |
| TGCT | 292 | 0.6903 | 0.1881 | 0.8592 | 0.3607 | 0.2303 | 0.0364 | 0.7334 | 0.5086 |
| PRAD | 834 | 0.6764 | 0.1849 | 0.8581 | 0.3682 | 0.2334 | 0.0369 | 0.9130 | 0.6617 |
| Bra. | 2939 | 0.7331 | 0.1827 | 0.8861 | 0.3632 | 0.2581 | 0.0370 | 0.9288 | 0.6805 |
| GBM | 1739 | 0.7207 | 0.1822 | 0.8790 | 0.3654 | 0.2542 | 0.0374 | 0.8944 | 0.6508 |
| LGG | 1200 | 0.7112 | 0.1575 | 0.8964 | 0.3602 | 0.2636 | 0.0364 | 0.9723 | 0.7181 |
| Hem. | 286 | 0.7178 | 0.1830 | 0.8734 | 0.3511 | 0.2478 | 0.0323 | 0.8937 | 0.6545 |
| DLBC | 77 | 0.7030 | 0.1747 | 0.8795 | 0.3719 | 0.2699 | 0.0347 | 0.9594 | 0.6719 |
| THYM | 209 | 0.7232 | 0.1860 | 0.8712 | 0.3434 | 0.2397 | 0.0315 | 0.8745 | 0.6494 |
| Gl. | 2690 | 0.6974 | 0.1900 | 0.8630 | 0.3792 | 0.2442 | 0.0408 | 0.8716 | 0.6295 |
| COAD | 1140 | 0.7088 | 0.1944 | 0.8648 | 0.3858 | 0.2426 | 0.0412 | 0.8675 | 0.6281 |
| ESCA | 215 | 0.6622 | 0.1681 | 0.8527 | 0.3339 | 0.2002 | 0.0281 | 0.6078 | 0.5283 |
| READ | 389 | 0.6929 | 0.1855 | 0.8653 | 0.3727 | 0.2394 | 0.0404 | 0.9654 | 0.6620 |
| STAD | 946 | 0.6934 | 0.1914 | 0.8623 | 0.3841 | 0.2581 | 0.0434 | 0.8693 | 0.6297 |
| End. | 1163 | 0.7042 | 0.1705 | 0.8719 | 0.3431 | 0.2435 | 0.0316 | 0.9064 | 0.6739 |
| ACC | 229 | 0.7445 | 0.1828 | 0.8738 | 0.3740 | 0.2786 | 0.0329 | 0.9060 | 0.6986 |
| PCPG | 242 | 0.7076 | 0.1613 | 0.8794 | 0.3276 | 0.2560 | 0.0314 | 0.9467 | 0.6621 |
| THCA | 692 | 0.6897 | 0.1696 | 0.8686 | 0.3383 | 0.2276 | 0.0312 | 0.8981 | 0.6621 |
| WSI Site |
Query Num. |
Slide Method | Sample Method | Adjacent Method | URICA (ours) | ||||
|---|---|---|---|---|---|---|---|---|---|
| mSim@5 | mIoU@5 | mSim@5 | mIoU@5 | mSim@5 | mIoU@5 | mSim@5 | mIoU@5 | ||
| Pul. | 2763 | 0.6812 | 0.1656 | 0.8582 | 0.3163 | 0.1671 | 0.0262 | 0.9402 | 0.6416 |
| LUAD | 1320 | 0.6833 | 0.1673 | 0.8633 | 0.3187 | 0.1721 | 0.0287 | 0.9489 | 0.6302 |
| LUSC | 1335 | 0.6846 | 0.1662 | 0.8536 | 0.3171 | 0.1647 | 0.0251 | 0.9346 | 0.6576 |
| MESO | 108 | 0.6208 | 0.1432 | 0.8506 | 0.2763 | 0.1534 | 0.0177 | 0.8907 | 0.5422 |
| Liv./PB. | 886 | 0.6572 | 0.1505 | 0.8557 | 0.2788 | 0.1401 | 0.0189 | 0.8525 | 0.5551 |
| CHOL | 55 | 0.6003 | 0.1147 | 0.8493 | 0.2665 | 0.1081 | 0.0152 | 0.9391 | 0.6251 |
| LIHC | 520 | 0.6634 | 0.1457 | 0.8653 | 0.2676 | 0.1388 | 0.0178 | 0.8014 | 0.4930 |
| PAAD | 311 | 0.6570 | 0.1649 | 0.8409 | 0.2998 | 0.1481 | 0.0215 | 0.8603 | 0.5821 |
| Uri. | 3209 | 0.6929 | 0.1684 | 0.8602 | 0.3065 | 0.1564 | 0.0239 | 0.9306 | 0.6485 |
| BLCA | 588 | 0.6325 | 0.1462 | 0.8424 | 0.2540 | 0.1332 | 0.0168 | 0.8402 | 0.5943 |
| KIRC | 1805 | 0.7105 | 0.1748 | 0.8632 | 0.3200 | 0.1607 | 0.0254 | 0.9560 | 0.6706 |
| KICH | 265 | 0.7242 | 0.1815 | 0.8649 | 0.3172 | 0.1701 | 0.0287 | 0.9400 | 0.5571 |
| KIRP | 551 | 0.6846 | 0.1649 | 0.8671 | 0.3130 | 0.1607 | 0.0246 | 0.9617 | 0.6563 |
| Gyn. | 2562 | 0.6752 | 0.1557 | 0.8599 | 0.2960 | 0.1486 | 0.0212 | 0.7993 | 0.5730 |
| UCEC | 811 | 0.6570 | 0.1424 | 0.8572 | 0.2556 | 0.1284 | 0.0157 | 0.7397 | 0.5539 |
| CESC | 358 | 0.5943 | 0.1306 | 0.8443 | 0.2625 | 0.1292 | 0.0154 | 0.6443 | 0.4366 |
| UCS | 95 | 0.6611 | 0.1349 | 0.8522 | 0.2780 | 0.1433 | 0.0135 | 0.9601 | 0.6361 |
| OV | 1298 | 0.7099 | 0.1725 | 0.8664 | 0.3318 | 0.1669 | 0.0268 | 0.9538 | 0.6764 |
| Mel. | 645 | 0.6414 | 0.1472 | 0.8422 | 0.2556 | 0.1391 | 0.0168 | 0.7295 | 0.4862 |
| UVM | 97 | 0.6316 | 0.1393 | 0.8455 | 0.2227 | 0.1308 | 0.0127 | 0.9584 | 0.7000 |
| SKCM | 548 | 0.6432 | 0.1486 | 0.8416 | 0.2614 | 0.1405 | 0.0176 | 0.7009 | 0.4594 |
| Pro./Tes. | 1126 | 0.6512 | 0.1633 | 0.8407 | 0.2978 | 0.1399 | 0.0221 | 0.8563 | 0.5864 |
| TGCT | 292 | 0.6614 | 0.1658 | 0.8415 | 0.3607 | 0.1382 | 0.0218 | 0.7296 | 0.4792 |
| PRAD | 834 | 0.6477 | 0.1624 | 0.8404 | 0.2989 | 0.1405 | 0.0221 | 0.9019 | 0.6250 |
| Bra. | 2939 | 0.6919 | 0.1561 | 0.8727 | 0.2883 | 0.1551 | 0.0222 | 0.9223 | 0.6427 |
| GBM | 1739 | 0.6786 | 0.1551 | 0.8649 | 0.2918 | 0.1528 | 0.0224 | 0.8863 | 0.6117 |
| LGG | 1200 | 0.7112 | 0.1575 | 0.8841 | 0.2832 | 0.1585 | 0.0218 | 0.9678 | 0.6817 |
| Hem. | 286 | 0.6842 | 0.1605 | 0.8575 | 0.2846 | 0.1493 | 0.0194 | 0.8887 | 0.6160 |
| DLBC | 77 | 0.6675 | 0.1522 | 0.8636 | 0.3112 | 0.1621 | 0.0208 | 0.9550 | 0.6317 |
| THYM | 209 | 0.6904 | 0.1635 | 0.8552 | 0.2748 | 0.1446 | 0.0189 | 0.8693 | 0.6114 |
| Gl. | 2690 | 0.6546 | 0.1655 | 0.8456 | 0.3087 | 0.1468 | 0.0245 | 0.8637 | 0.5953 |
| COAD | 1140 | 0.6642 | 0.1676 | 0.8475 | 0.3132 | 0.1458 | 0.0247 | 0.8573 | 0.5959 |
| ESCA | 215 | 0.6002 | 0.1388 | 0.8353 | 0.2666 | 0.1202 | 0.0169 | 0.5939 | 0.4923 |
| READ | 389 | 0.6402 | 0.1601 | 0.8483 | 0.3041 | 0.1441 | 0.0243 | 0.9619 | 0.6160 |
| STAD | 946 | 0.6613 | 0.1712 | 0.8444 | 0.3147 | 0.1552 | 0.0260 | 0.8646 | 0.5959 |
| End. | 1163 | 0.6673 | 0.1491 | 0.8564 | 0.2741 | 0.1464 | 0.0189 | 0.8931 | 0.6393 |
| ACC | 229 | 0.7169 | 0.1647 | 0.8587 | 0.2996 | 0.1672 | 0.0197 | 0.8929 | 0.6662 |
| PCPG | 242 | 0.6686 | 0.1402 | 0.8651 | 0.2619 | 0.1540 | 0.0189 | 0.9387 | 0.6292 |
| THCA | 692 | 0.6505 | 0.1471 | 0.8527 | 0.2699 | 0.1368 | 0.0187 | 0.8836 | 0.6263 |
Across all three retrieval settings, URICA consistently outperforms existing methods on mIoU — the metric most reflective of structural fidelity. At top-1, URICA achieves the highest mIoU on all 29 subtypes, with particularly large gains on sites where competing methods struggle: for example, Pul. mIoU@1 improves from 0.48 (Sample Method) to 0.71, and Uri. from 0.47 to 0.73. As the retrieval depth increases to top-3 and top-5, the gap widens further: Slide and Adjacent methods degrade rapidly (e.g., Adjacent mIoU@5 drops below 0.03 on most sites), whereas URICA maintains strong performance — Pul. mIoU@5 remains at 0.64, Bra. at 0.64, and End. at 0.64. On mSim, URICA leads or is competitive across nearly all settings, confirming that its retrieved regions are both semantically similar and spatially faithful. These quantitative results are further corroborated by qualitative retrieval examples below.

As shown in Figure 4, we visualize the rank-1 and rank-5 retrieval results across seven representative TCGA cohorts. Even at rank-5, URICA retrieves regions that faithfully reproduce the query’s tissue morphology, boundary structure, and staining distribution — despite variations in orientation, scale, and slide appearance. For instance, the retrieved regions for brain (GBM/LGG) and kidney (KIRC) cohorts closely mirror the spatial arrangement and cellular density of the query, whereas baseline methods tend to return regions with only superficial texture overlap. Overall, these results confirm that URICA can reliably retrieve clinically coherent regions by jointly capturing semantics and structure. For slide-level retrieval, URICA also achieves 98.38 ± 1.25% mMV@5, exceeding all prior methods. For additional metrics, ablations, and efficiency analysis, please refer to the main paper and appendix.
Human Study
We further conduct a human study to assess whether URICA's retrieved regions align with expert judgment beyond automatic metrics. Specifically, pathologists evaluate the top-5 retrieved candidates across 10 anatomical sites from two complementary perspectives: (1) the quality of the candidate set itself, measured by average expert-rated similarity and intra-top-5 consistency; and (2) the ranking accuracy, measured by order quality that compares the model's ranking against expert preference.
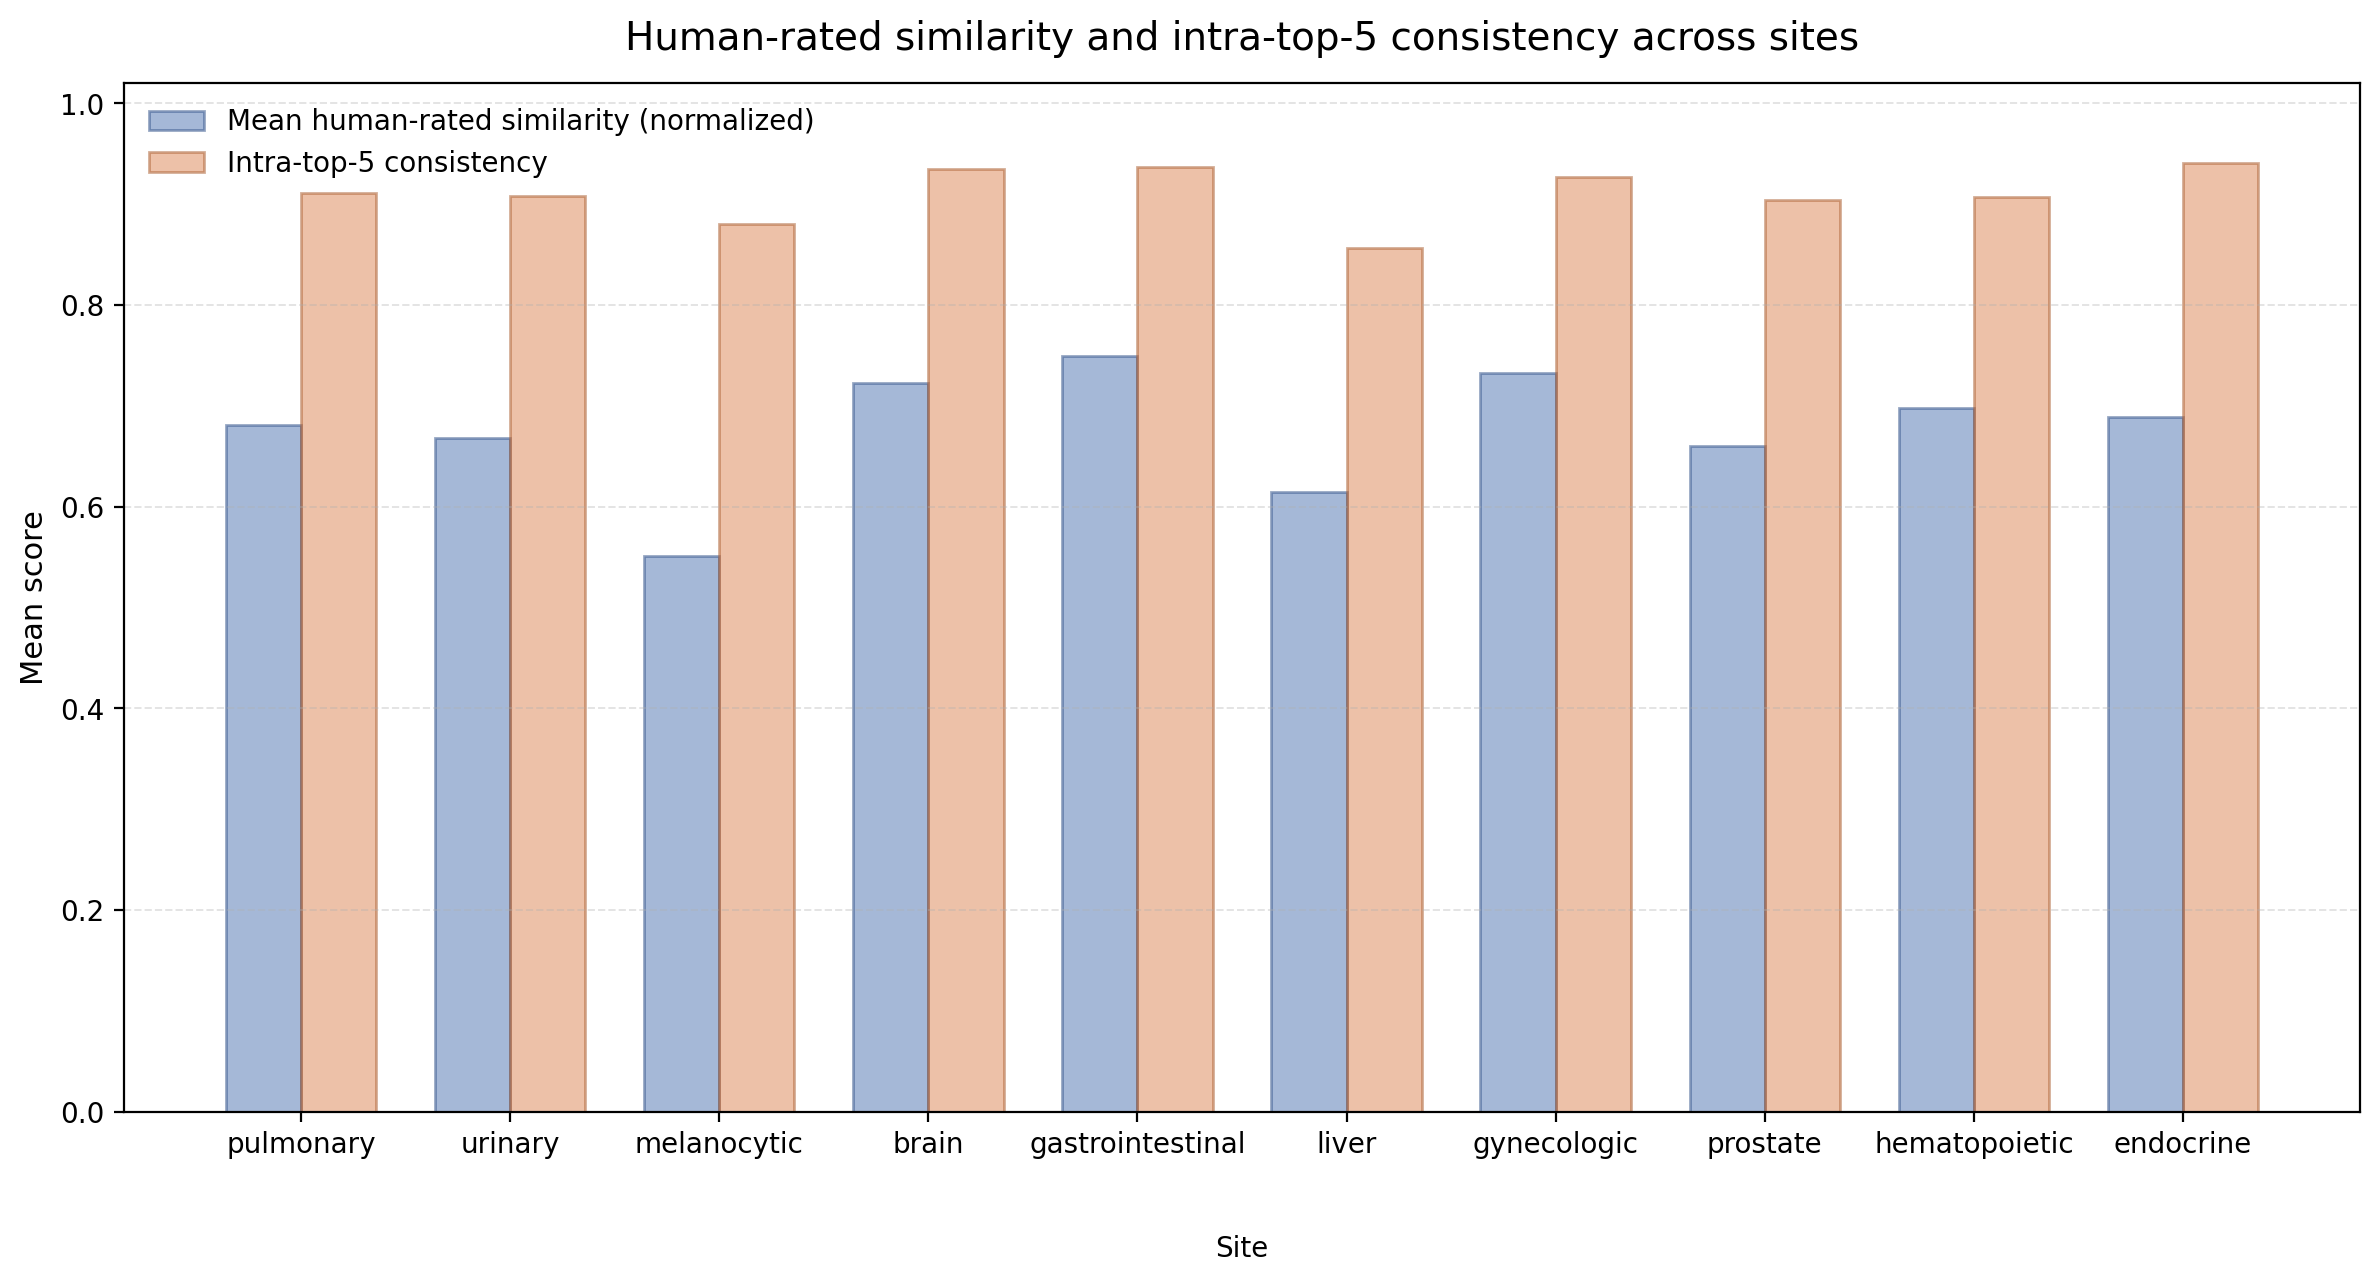
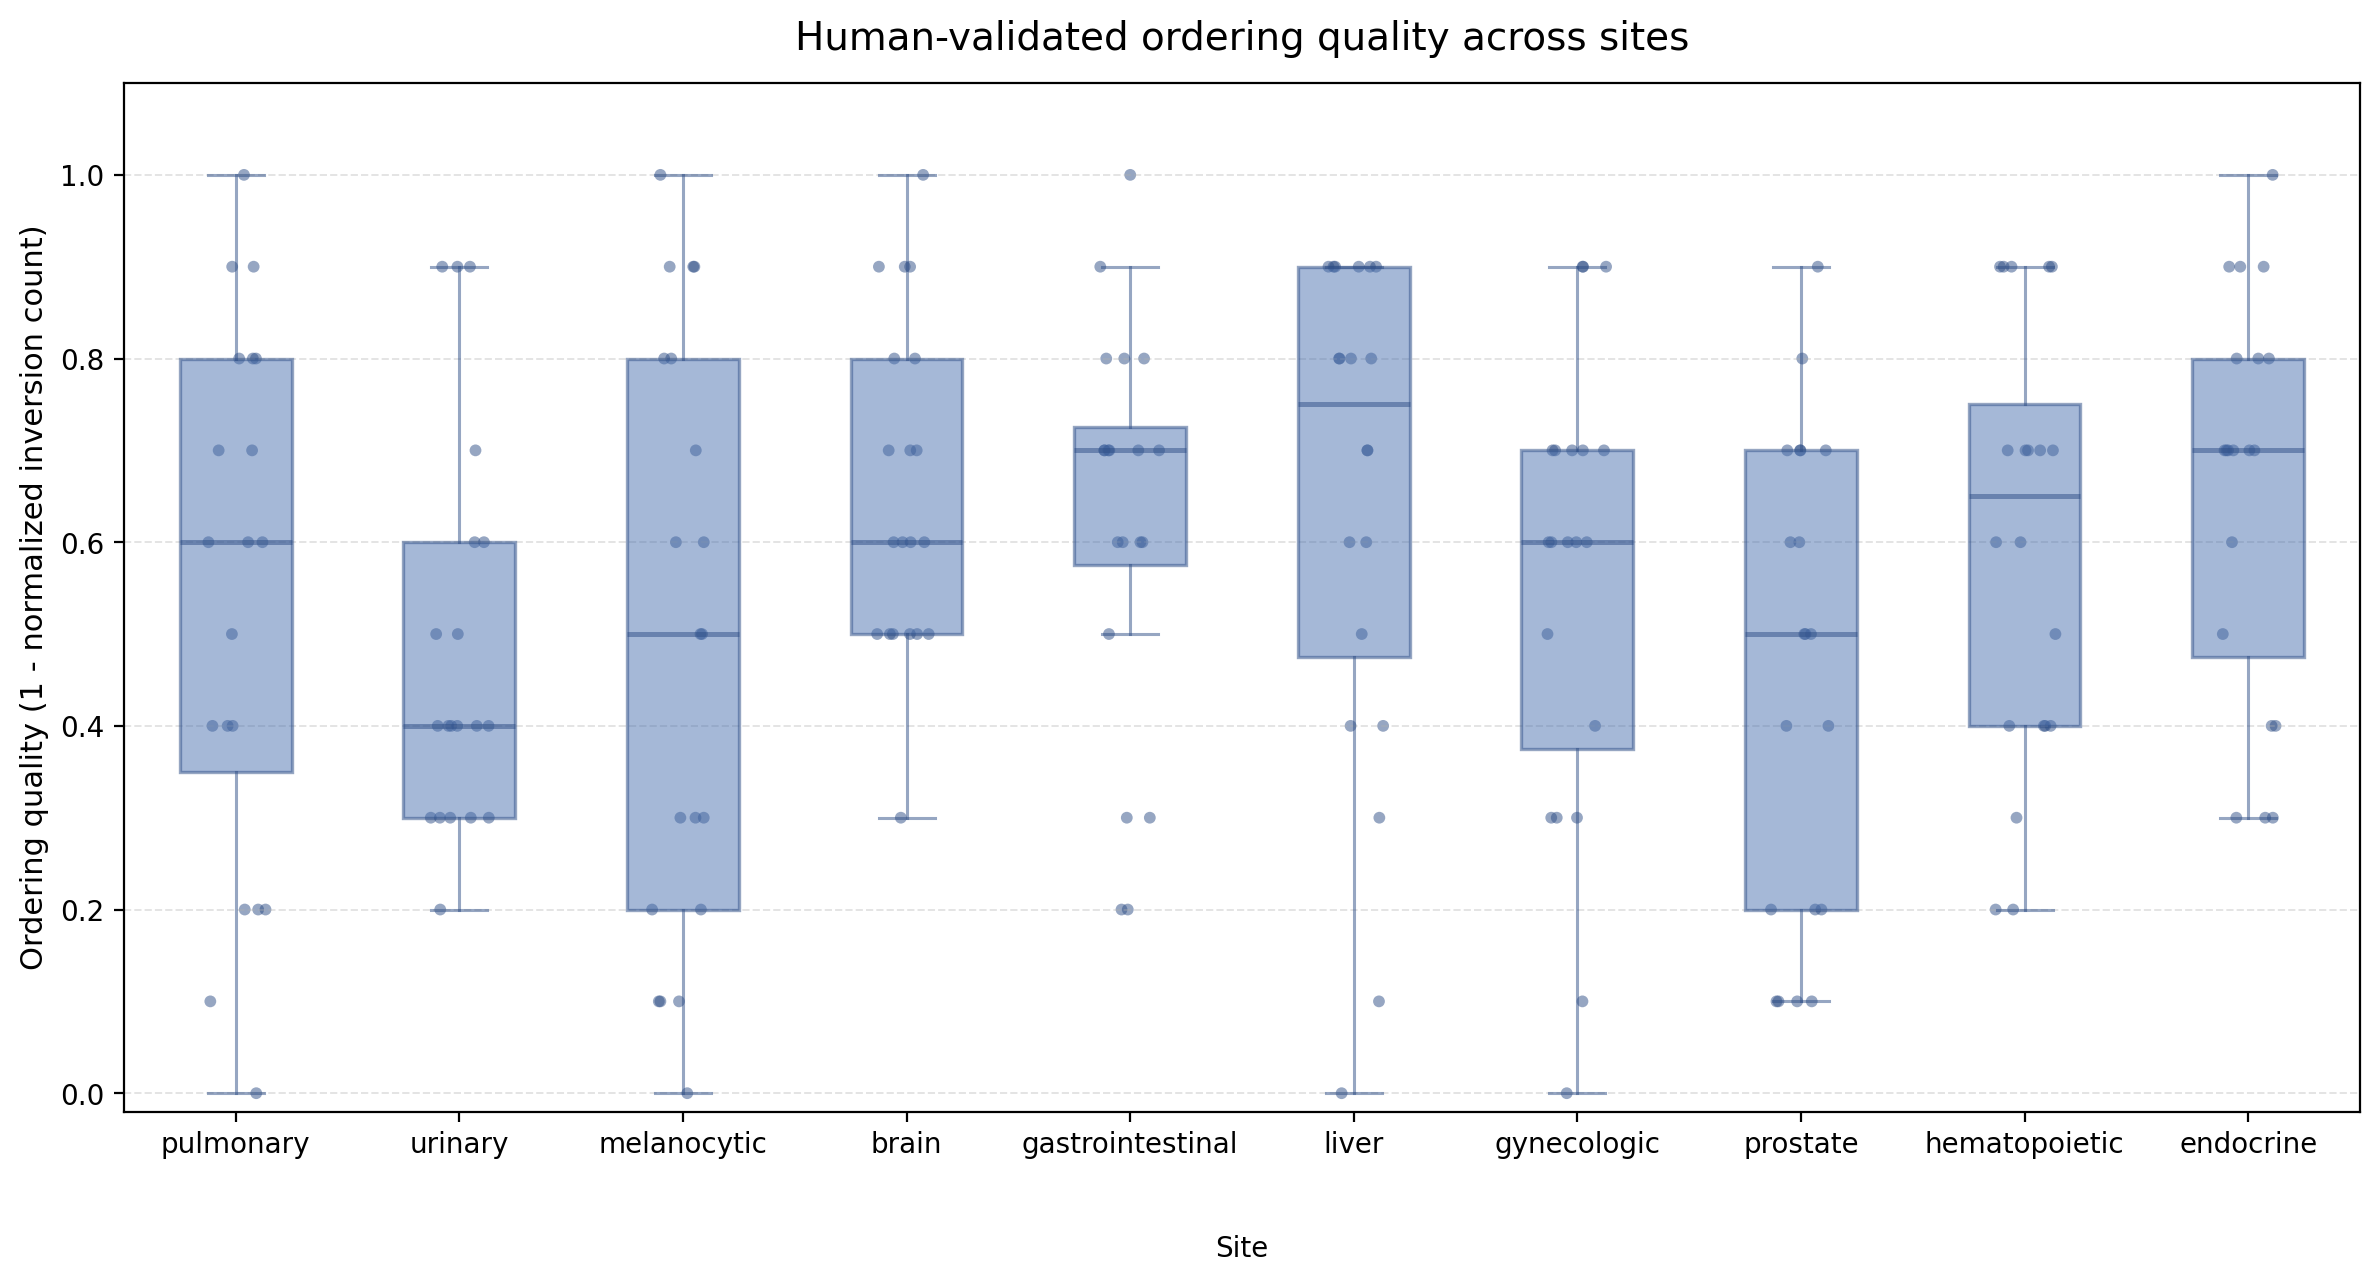
The human evaluation confirms that URICA's retrieved candidates are clinically meaningful and internally consistent. Averaged over 10 anatomical sites, the mean expert-rated similarity reaches 7.09 (out of 10), the mean intra-top-5 consistency reaches 0.911, and the mean order quality is 0.570. The high consistency score indicates that the top-5 candidates within each query are similarly relevant, rather than mixing strong and weak matches. Among individual sites, gastrointestinal (7.74) and gynecologic (7.59) achieve the highest similarity scores, while brain (0.655) and endocrine (0.655) show the strongest ranking agreement with pathologists. Melanocytic cases present the most challenging scenario, with the lowest similarity (5.96) and consistency (0.880), likely reflecting limited database coverage for this tissue type. Overall, the results demonstrate that URICA retrieves high-quality candidate sets across diverse anatomical sites, while also highlighting opportunities for further improvement in ranking accuracy.
Cite Us
@inproceedings{su2026urica,
    title={URICA: A Uniformity Region Affine Identifier Capture Algorithm for Arbitrary Region Retrieval in Pathology Images},
    author={Su, Ri and Chen, Zhao and Cao, Caleb Chen and Chen, Lei},
    booktitle={Proceedings of the IEEE/CVF Conference on Computer Vision and Pattern Recognition},
    pages={32777--32786},
    year={2026}
}